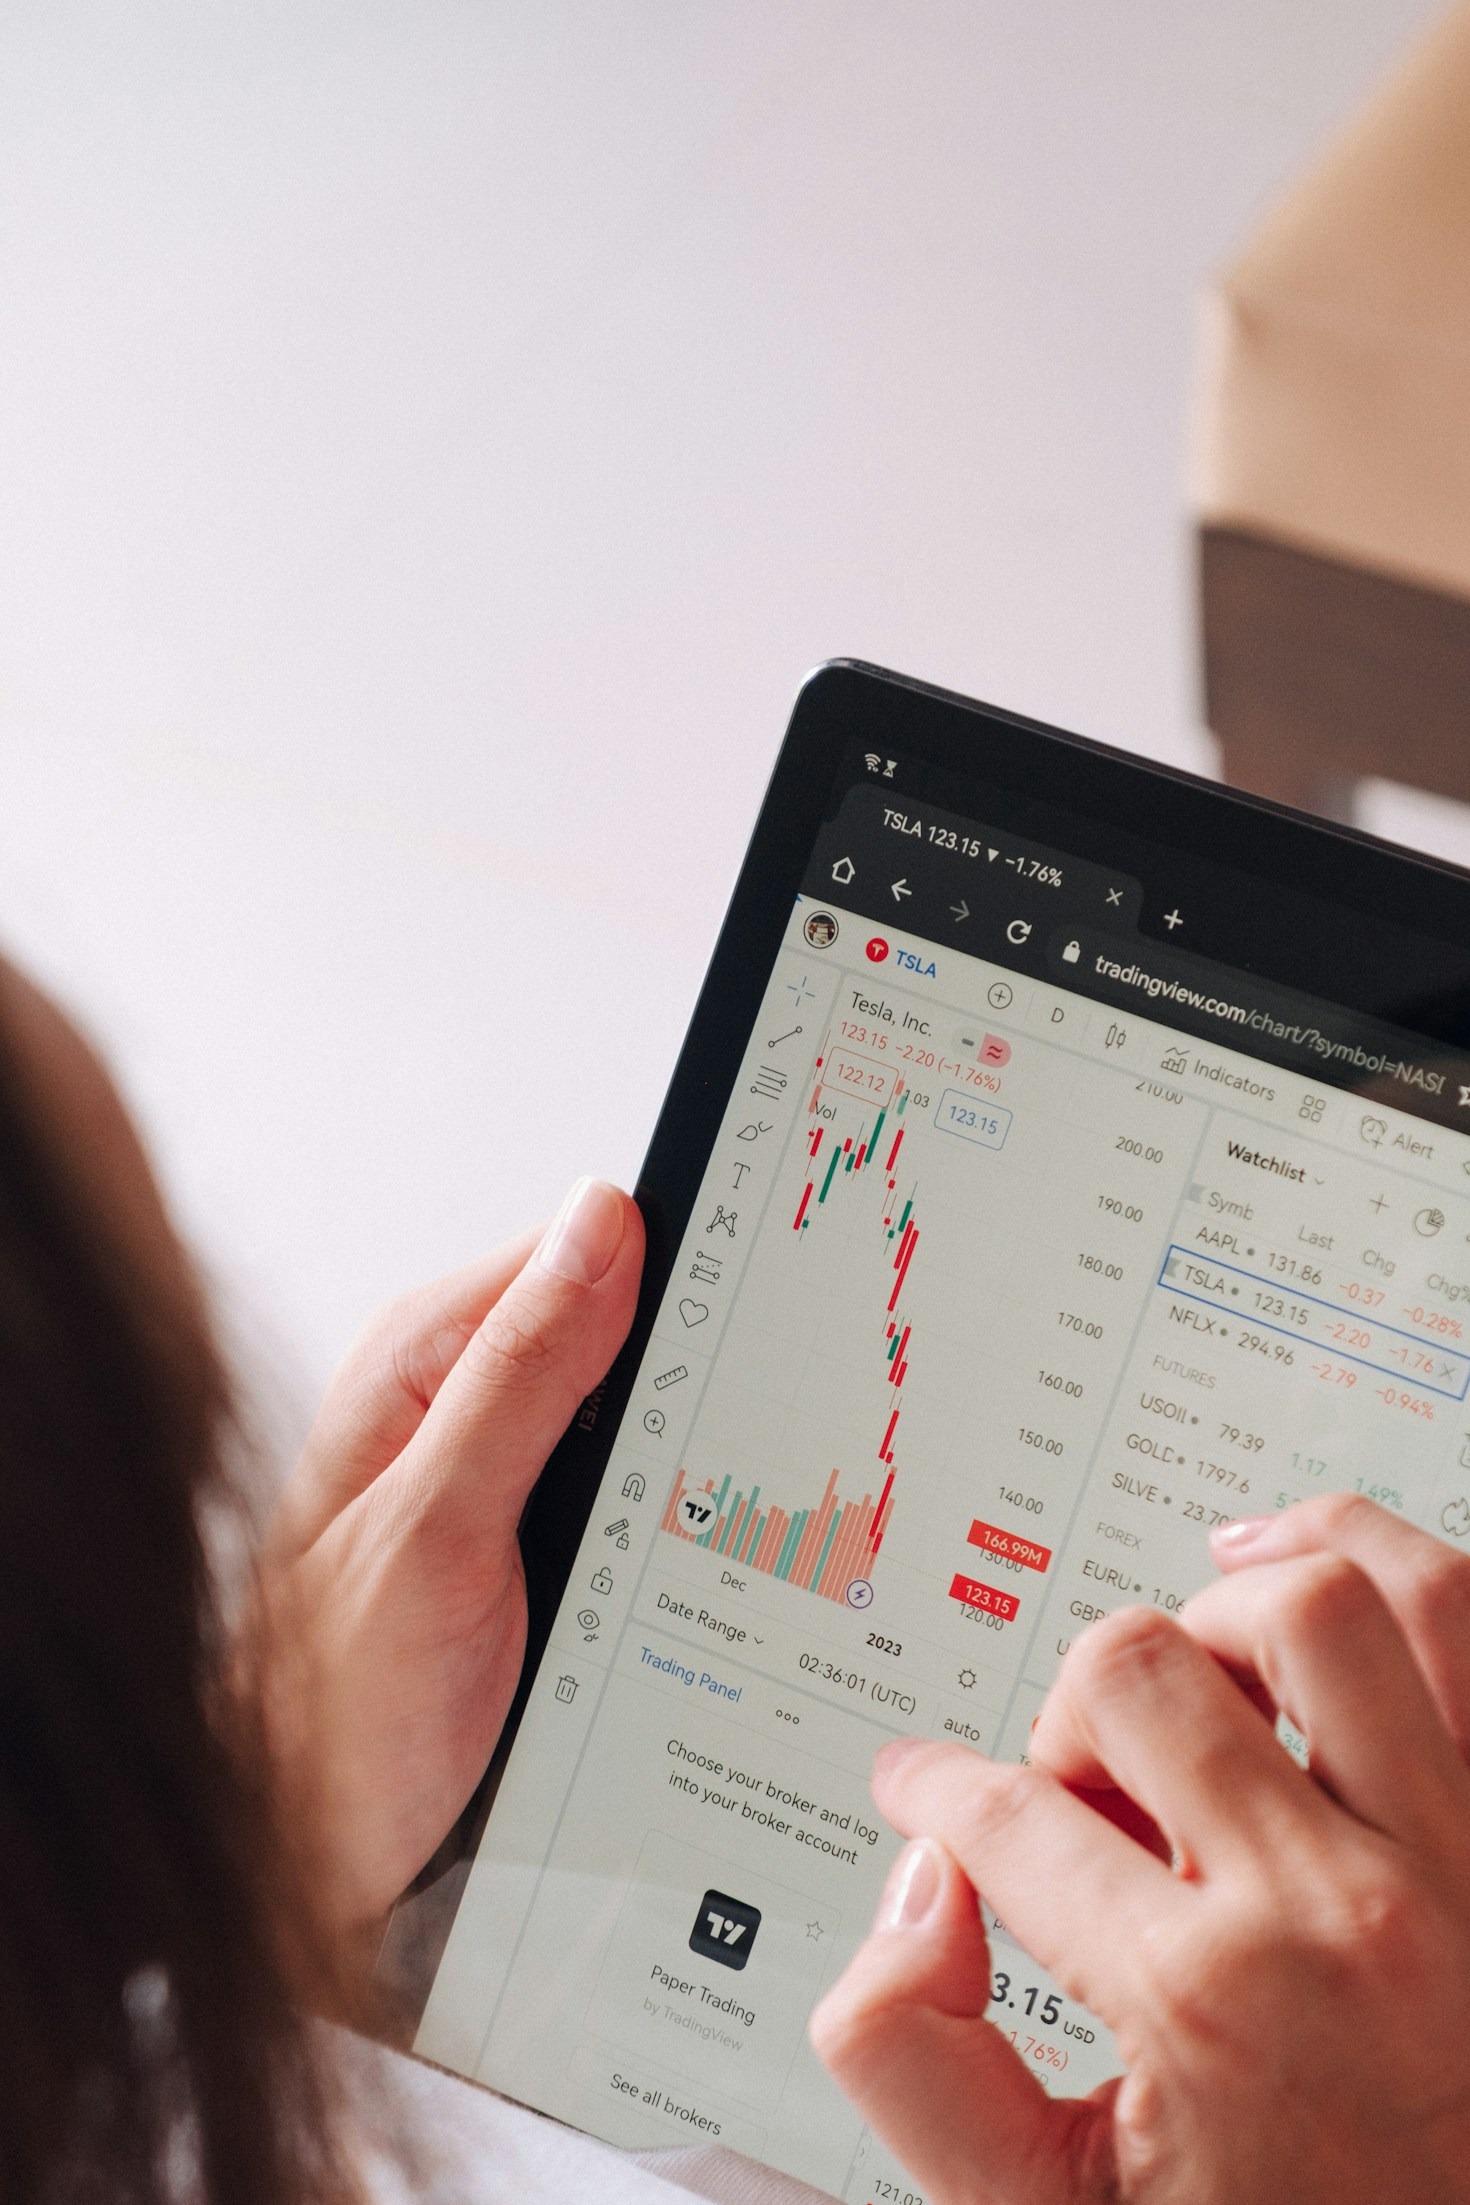

If you’re new to forex trading, learning how to read forex charts is one of the most important skills you can develop. Every trading decision begins with understanding what the market is doing, and forex charts provide the information you need to analyse price movements, identify trends and make informed trading decisions.
The good news is that reading forex charts isn’t as complicated as it may seem. Once you understand the basics, you’ll be able to recognise market trends, spot trading opportunities and avoid many common beginner mistakes.
What Is a Forex Chart?
A forex chart is a visual representation of the price movement of a currency pair over a specific period. Instead of looking at rows of numbers, traders use charts to quickly identify patterns and predict potential market direction.
For example, if you’re trading EUR/USD, the chart shows how the euro’s value changes against the US dollar over time.
Most trading platforms offer three main chart types:
- Line charts
- Bar charts
- Candlestick charts
Among these, candlestick charts are the most popular because they provide the most detailed price information.
Understanding Candlestick Charts
A candlestick represents price movement during a chosen timeframe. Depending on your settings, one candle may represent one minute, five minutes, one hour, four hours or even one day.
Each candlestick displays four important pieces of information:
- Open Price – The price where the period began.
- Close Price – The price where the period ended.
- High Price – The highest price reached.
- Low Price – The lowest price reached.
A bullish candle (usually green or white) means the price closed higher than it opened, indicating buying pressure.
A bearish candle (usually red or black) means the price closed lower than it opened, suggesting selling pressure.
For example, if EUR/USD opens at 1.1700, rises to 1.1725, drops to 1.1695, and finally closes at 1.1720, the candle is considered bullish because it closed above its opening price.
Learn to Identify Market Trends
Before placing any trade, determine the market’s overall direction.
Uptrend
An uptrend occurs when price forms:
- Higher highs
- Higher lows
This suggests buyers are in control.
Downtrend
A downtrend occurs when price creates:
- Lower highs
- Lower lows
This indicates sellers are dominating the market.
Sideways Market
Sometimes price moves within a range without making significant highs or lows. This is called a ranging or sideways market.
As a beginner, it is generally safer to trade in the direction of the prevailing trend rather than trying to predict reversals.
Understand Support and Resistance
Support and resistance are two of the most important concepts in technical analysis.
Support
Support is a price level where buying pressure is strong enough to prevent the market from falling further.
When price reaches support, it often bounces upward.
Resistance
Resistance is a level where selling pressure prevents prices from rising further.
When price approaches resistance, it often reverses downward.
These levels help traders determine potential entry points, stop-loss placement and profit targets.
Watch for Breakouts
Markets do not stay within support and resistance forever.
A breakout occurs when price moves decisively above resistance or below support.
An upside breakout may signal the beginning of a bullish trend.
A downside breakout may indicate a bearish trend.
However, not every breakout is genuine. False breakouts occur frequently, so many experienced traders wait for confirmation before entering a trade.
Learn Common Candlestick Patterns
Candlestick patterns help traders understand market sentiment.
Hammer
A hammer has a small body with a long lower shadow.
It often appears after a downtrend and suggests buyers are beginning to regain control.
Doji
A Doji forms when the opening and closing prices are nearly identical.
It signals market indecision and may indicate an upcoming reversal.
Bullish Engulfing Pattern
This occurs when a large bullish candle completely covers the previous bearish candle.
It often signals the beginning of an upward move.
Bearish Engulfing Pattern
A bearish engulfing pattern forms when a large bearish candle completely engulfs the previous bullish candle.
This often indicates increasing selling pressure.
Choose the Right Timeframe
Different traders use different chart timeframes depending on their trading style.
One to Five Minutes
Suitable for scalpers who make multiple trades within minutes.
Fifteen to Thirty Minutes
Popular among beginner day traders because they provide a balance between speed and clarity.
One Hour to Four Hours
Ideal for swing traders looking for higher-quality trade setups.
Daily Chart
The daily timeframe provides the clearest view of the market’s long-term direction.
Many experienced traders first analyse the daily or four-hour chart before using lower timeframes to find precise trade entries.
Use Technical Indicators Wisely
Many beginners make the mistake of adding too many indicators to their charts.
Instead, start with just one or two reliable tools.
Moving Average
Moving averages help identify the overall market trend.
The 50-period and 200-period moving averages are among the most commonly used.
Relative Strength Index (RSI)
The RSI measures market momentum and identifies potential overbought or oversold conditions.
Although indicators are helpful, they should support your analysis rather than replace it.
Example of Reading a Forex Chart
Imagine you are analysing EUR/USD.
First, you check the daily chart and notice that price is making higher highs and higher lows.
Next, the market pulls back to a strong support level.
A bullish hammer candlestick appears.
The RSI is around 45, suggesting there is still room for price to rise.
The next candle closes above the hammer.
These combined signals provide a stronger reason to consider a buy trade than relying on any single indicator alone.
A Simple Checklist Before Every Trade
Before entering any forex trade, ask yourself:
- What is the overall trend?
- Where are the nearest support and resistance levels?
- Has a reliable candlestick pattern formed?
- Do my indicators confirm the setup?
- Where will I place my stop-loss?
- Where will I take profit?
Following the same process for every trade helps reduce emotional decisions and improves consistency.
Practise Before Trading Real Money
The best way to improve your chart-reading skills is through practice.
Open a free demo account on platforms such as MetaTrader 4 or MetaTrader 5 and spend time analysing the market every day.
Practise identifying trends, drawing support and resistance levels, recognising candlestick patterns and predicting where price may move next.
Review your analysis after each trading session to understand what you got right and where you can improve.
Trading on a demo account allows you to build confidence and develop your strategy without risking real money.
Final Thoughts
Learning how to read forex charts is the foundation of successful trading. Rather than relying on luck or following random online signals, take the time to understand how price behaves.
Master the basics of candlesticks, trends, support and resistance, chart patterns and simple technical indicators before moving on to advanced strategies.
Remember, becoming consistently profitable does not happen overnight. It takes patience, discipline and continuous learning. The more time you spend analysing charts, the more confident and skilled you will become as a forex trader.
Ready to begin? Open an account, join our trading community and start your forex journey here.
ALSO READ: How to Start Forex Trading with $100: A Beginner’s Complete Guide